
(yearly average prices based on London PM Fix)
By 1979, investors and other market participants had come to the strong conviction that the silver market was facing a severe shortage of metal, and that prices were likely to rise sharply at some point. The market had been living off of investor selling for seven years. Prices had risen from the beginning of the decade, but there were serious questions as to how much longer investors would be willing and able to continue supplying silver to fabricators, at least at the prices seen in the mid-1970s.
World economic and political events also were coming to bear on the silver market, most notably in the form of a major cyclical upward surge in inflation throughout the industrialized world. Sensing that silver prices should be adjusting upward to compensate for these inflationary trends, many investors decided that silver prices between $4.00 and $5.50, which had prevailed during most of the late 1970s, were too low. Investors ceased selling their old silver holdings, and instead began adding to their holdings. This added further upward pressure to the price of silver. Simplistic retrospectives of the silver market in late 1979 tend to focus on the high-profile purchases of large amounts of silver and silver futures by various wealthy individuals; in reality, there was a tremendously broad-based rush to buy silver by investors worldwide at the time.
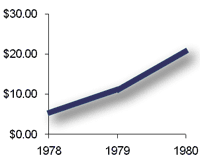
By the final quarter of 1979, silver prices had risen to levels between $15.00 and $25.00 per ounce. At these levels several physical market forces combined to act against higher prices. Additionally, the two major U.S. futures exchanges that traded silver at the time took steps to force those with margined long positions to liquidate their positions. During the Hunt brothers’ accumulation of the silver, prices of silver bullion rose from $11 an ounce in September 1979 to $49.45 an ounce in January 1980 based on London PM Fix. Silver prices ultimately fell to below $11 an ounce two months later.
As silver prices rose above $15.00 in September 1979, fabrication demand began to be affected. On an annual average basis, industrial silver use fell a relatively mild 0.9% to 445.1 million ounces in 1979. Demand had held up reasonably well during the first three quarters of the year. However, a sharp cut-back in demand in the fourth quarter led to overall annual decreases in silver use. By some estimates, industrial use of silver was 40% lower in the last quarter of 1979 than it had been in the first quarter of that year.
When silver prices rose sharply in 1973-1974, manufacturers began searching for ways to reduce their need to use silver. Several substitutes for silver and methods to reduce per-unit silver use were developed, but they were too expensive to implement as long as silver was around $5.00 per ounce. When silver rose to $15.00 and more however, fabricators were able to introduce these measures rapidly. Demand also quickly declined for jewelry and sterlingware.
Investors began to sell large amounts of silver especially old coins from the 1960s. Other sold large amounts of sterlingware and jewelry for its silver content.
A host of political events, including the continuous U.S. hostage crisis in Iran and the Soviet invasion of Afghanistan, motivated investment demand, helping keep silver prices high and volatile through 1980. High inflation, high nominal interest rates, and negative real interest rates further stimulated investor interest in silver and other tangible assets. Prices dropped as low as $10.80 in March, but rose back to $25.00 in September, as the Iran-Iraq war erupted. By the end of 1980 silver prices had subsided once more to around $16.00.
These high silver prices meanwhile were having an effect on the physical silver market conditions. Total supply rose form 434.8 million ounces in 1978 to 505.0 million ounces in 1979, and then to 584.6 million ounces in 1980. The bulk of this increase occurred in secondary recovery. Total secondary recycling of silver doubled, from 152.0 million ounces in 1978 to 302.0 million ounces in 1980. The recovery of silver from old coins, those holdings taken in by investors during the 1960s, increased from 21 million ounces in 1978 to 45 million ounces the next year, and then to 94 million ounces in 1980. Refiners faced substantial backlogs, sometimes of 6-12 months in processing these materials.
Mine production remained almost unchanged during this time, and actually was lower in 1980, at 264.6 million ounces, than it had been in 1978. (A U.S. copper industry strike, along with a strike at a major U.S. silver mine, were major factors behind the low output.) Mine developments have long lead times, and the increases in output that came about in response to the 1979-1980 jump in silver prices did not appear until the mid-1980s.
Prices also had an effect on fabrication demand, compounded in 1980 by the onset of the deepest recession since World War II. Industrial silver use fell from 449.1 million ounces in 1978 to 362.5 million ounces in 1980, a level fully 25% below the 1976 cyclical peak of 481.0 million ounces. The last countries using silver in circulating coinage, Austria, France and West Germany, withdrew from that activity, reducing silver use in coinage on a worldwide basis from 39.5 million ounces in 1978 to 15.0 million ounces in 1980.
The combination of higher secondary recovery and lower fabrication demand brought an abrupt end to the eight years of silver market supply deficits. In 1978 new supply had fallen 53.8 million ounces short of fabrication requirements. In 1979 there was a 28.9 million ounce surplus.
In 1980 this surplus reached 207.1 million ounces, nearly as high as the 228.9 million ounce surplus that had resulted from the 1968 run-up in silver prices and the Treasury’s sales programs. The increase in the recovery of silver from old coins accounted for nearly half of the surplus.