Silver Price & Investment
-
SILVER IN INDUSTRY
-
SILVER & SUSTAINABILITY
-
SILVER SUPPLY & DEMAND
-
SILVER PRICE & INVESTMENT
-
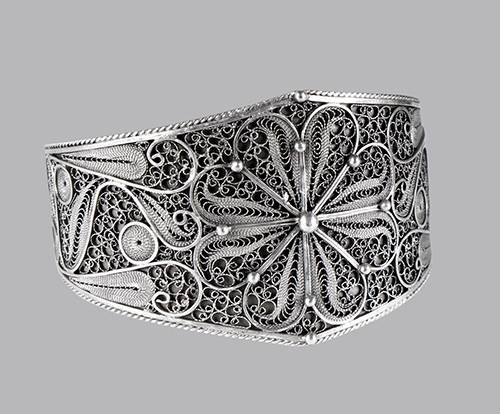
Silver Jewelry
-
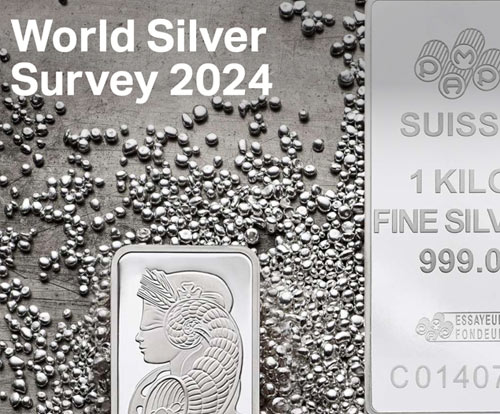
WORLD SILVER SURVEY 2024