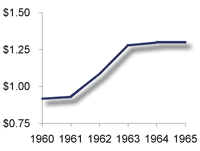


(yearly average prices based on London PM Fix)
During the 1960s the Treasury moved from being a net buyer of silver to being a net seller of silver. In 1960, the Treasury sold 22 million ounces of silver in bullion form, and used another 46 million ounces in coinage. The next year the Treasury had to sell 63 million ounces of bullion and use another 56 million ounces to replace silver coins that had been taken out of circulation by investors. That year, 1961, the Treasury realized that it would run out of silver for use in coinage and as a reserve against silver certificates unless it took drastic measures to begin phasing silver out of currency. In 1961, the Treasury ordered $5 and $10 silver certificates out of circulation, which freed up silver reserves and reduced the public’s call on Treasury silver. In November 1961 the government also suspended silver bullion sales by the Treasury at the formerly fixed price of 91 cents.
Once the Treasury stopped selling at that price, market quotes for silver quickly rose. In June 1963 the Treasury replaced the $1 silver certificate with Federal Reserve notes. By 1963, silver prices reached $1.29, the monetary value of silver in coinage. At prices above this level, holders of silver certificates would have been able to redeem them for more valuable silver, under the now-defunct silver certificate legislation. (The other trigger price the Treasury worried about was $1.38, at which level it would have become profitable to recycle coinage for its silver content.)
During this transition period, the U.S. Treasury had to keep the silver market well supplied, so that the silver market would remain calm until silver had been completely withdrawn from currency. In late 1963 the Treasury resumed its silver bullion sales, as part of this effort. Over the six years between 1960 and 1965, the Treasury sold a total of 342 million ounces of silver bullion and used another 814 million ounces of silver in coinage. In total, the Treasury used 1,156,000,000 ounces of its silver reserves. Much of this silver, especially the bulk of its used in coins, was quickly bought up by investors. Government steps to remove silver from the currency led investors to conclude that the price of silver would rise sharply once the Treasury no longer was supplying the market with such large volumes of the metal.
Fabrication demand continued to rise sharply. Industrial use, excluding coinage, rose at a 9% pace per year, from 212.9 million ounces in 1959 to 355.8 million ounces in 1965. Including coinage, which grew rapidly during this same time due to the investor run on coins, total fabrication demand rose 16% per annum. Mine production, in contrast rose only 1.9% per year from 195.6 million ounces in 1959 to 218.4 million ounces in 1965.
Secondary recovery of silver was starting to expand, in part spurred by the realization that with the passing of Treasury silver sales and coinage programs the market would need to recover increasing amounts of silver from scrapped items. It was clear to market participants that silver prices had been restrained by the Treasury’s willingness to fill the gap between market supplies and industrial demand, and that once the Treasury’s silver was gone, additional supplies would have to be found elsewhere. Coin melt rose from 10 million ounces in 1960 to 30 million ounces in 1965. Silver recycling from other items rose from 40 million ounces in 1960 to 57 million ounces in 1965.
