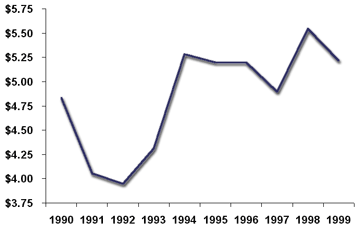
(yearly average prices based on London PM Fix)
Throughout the 1990′s, the main question for the silver market was the rate at which above-ground stocks of bullion and coins were being consumed by the widening gap between fabrication demand and conventional supply, and when this erosion of stocks might begin to significantly impact the price of the metal. Mine production of new silver rose by only 4% from 1990 to 1999, while total fabrication demand increased by 22% during the same period. While the fundamentals for silver strengthened during the past decade, the price of silver slowly climbed from an average price of $4.83 in 1990 to an average price of $5.22 in 1999.
In 1999, silver’s price performance was subdued following an eventful 1998, and was off 5.8% from the previous year, but it did finish the year up 6.7% from its starting level (ending the year at $5.33 having begun it at $4.99). It traded in a narrow range between $4.88 and $5.79.
Substantial flows of silver out of China helped to keep the price in check in 1999, and had similar impacts in the early 2000s.
The gold/silver ratio (the number of ounces of silver it takes to buy one ounce of gold) is another market indicator some analysts watch. This ratio has at times been a closely followed indicator of the relative trends in the two markets and in the past has been used by investors as signals for buying, selling, or exchanging gold and silver. The ratio for 1999 was 53.37, versus 53.08 in 1998. The average for the period 1968-1999 is 50.18.
