
(yearly average prices based on London PM Fix)
The weighted average price paid in these investor acquisitions, using annual average prices, was $1.88 per ounce. This figure will be important in understanding the next phase of the silver market, from 1971 into 1979, when the new supply of silver fell short of industrial requirements and the resulting deficit was accommodated by investor selling.
While investor demand was strong and industrial demand remained at healthy levels, Mine production rose at a 3.4% per annum rate, from 218.4 million ounces in 1965 to 258.5 million ounces in 1970. (Actually, mine output of silver was not as vibrant as these figures suggest, since 1965 was a year of stable output and 1970 represented a cyclical peak in silver production. Output fell back the following year, and did not regain its 1970 level until 1977.) Secondary supply also continued to expand, in part due to the rise in silver prices, which made recycling much more attractive. Bloated by continued U.S. government sales, total supply remained high throughout this period.
By 1971 U.S. government stocks had fallen from their 1959 peak of 2.1 billion ounces to around 170 million ounces. The U.S. government had removed silver entirely from its currency, and ceased to intervene in the silver market. Total silver supplies had reached a record 747.4 million ounces in 1965, of which 54 percent, or 400 million ounces, came from the U.S. Treasury. From that point onward, the Treasury was backing out of the silver market, and total supply declined steadily, and never has approached that 1965 record again.
Total silver supplies had declined to 381.3 million ounces by 1971, their lowest level since 1960. New mine production accounted for 65% of this total, or 247.3 million ounces. Secondary and other supplies totaled 134.0 million ounces. Throughout the 1970s, mine production remained rather static, fluctuating between 236.6 million ounces in 1974 and 272.0 million ounces in 1979. Secondary supply rose from 1972 to 1974, in line with silver prices, and then fell back to 152.0 million ounces in 1978.
Fabricating demand rose sharply in the early 1970s, from 414.4 million ounces in 1971 to 545.0 million ounces in 1973. Demand then dropped for two years, as a worldwide recession reduced consumer demand for silver-using end products and as higher silver prices led to some reductions in silver use. Demand fell to 497.9 million ounces in 1974 and 437.9 million ounces in 1975. Use rebounded the next year, to 511.0 million ounces, before stabilizing between 488.6 million ounces and 491.3 million ounces in 1977 and 1978.
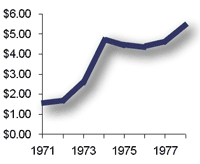
Total new silver supplies fell far short of meeting these requirements. From 1971 through 1978 there was a cumulative deficit of new supply over demand of 415.8 million ounces. The silver that filled this gap came from the 620.5 million ounces of silver inventories – many held by investors – built up during the previous seven years. By becoming net sellers of silver, investors replaced the U.S. Treasury as the source of silver to make up for a major, ongoing shortage of silver. The difference was that in the early 1960s the U.S. Treasury had sold at a fixed price because it was acting to restrain silver prices. In contrast, investors wanted increasingly higher prices for this service. The weighted average price of the investor silver sales from 1971 through 1978 was $3.21, 71% higher than the price they had paid for this metal in the late 1960s. The average price of silver was $1.55 in 1971. The average price rose to $4.71 in 1974, and then spent the next four years between $4.35 and $5.40.