
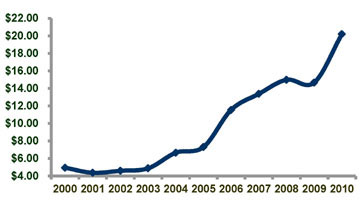
(yearly average prices based on London PM Fix)
Silver prices remained under pressure for most of 2000, averaging $4.95 per troy ounce. The trading range did manage to increase marginally year-on-year, recording a high of $5.45 in February of 2000 and a low of $4.57 in December. The silver price softened throughout the year, largely because of continued Chinese government sales and ongoing private disinvestment.
In 2001, silver prices averaged $4.37 per troy ounce. The metal ended the year on a much-brighter note, with silver fixing at $4.52 on December 31, only 7 cents down from the year’s first trading day.
In the face of an enduring global economic slowdown, the silver price demonstrated resilience in 2002. With an average price of $4.60 per ounce in 2002, silver recorded a 5% year-on-year increase over 2001. Silver retained its characteristics as a precious metal, rising in value during periods of crisis last year.
The average silver price in 2003 was $4.85 per ounce – a 5.4% increase over 2002. Much stronger investment interest and the improved fabrication demand scenario, which picked up strongly from the third-quarter onwards, propelled the silver price to $5.97 per ounce at year’s end.
The silver price in 2004 staged a dramatic rally, rising a robust 36% to average $6.66 per ounce. This compared to an average price of $4.85 in 2003. This stunning price performance reflects fundamental changes in silver’s supply/demand balance. Last year also saw a boom in investor activity, mainly driven by funds operating on futures exchanges and considerable buy side interest from high net-worth individuals.
In 2005, the silver price experienced a 10% increase over the average 2004 price of $6.65 per ounce, to an average of $7.31 per ounce.
In 2006, the silver price experienced a 58% increase over the average 2005 price of $7.31 per ounce. The silver price reached levels not seen in 26 years and was the leader when compared with gold (36% increase) and platinum (27% increase). The primary factor driving the stronger silver price was the continued strength of investment demand, which returned in earnest in 2005, was sustained in 2006. Much of the investment demand can be attributed to the successful launch of Barclays’ Global Investors iShares Silver Trust Exchange Traded Fund (ETF), (SLV sitcker symbol) which was introduced in late April 2006, and is now managed by BlackRock.
The annual silver price, led by continued strong investor and industrial applications demand, averaged an impressive $13.38 in 2007. This result represented a 16% price increase over 2006, and on a percentage basis was stronger than that enjoyed by gold, platinum and palladium last year. When looking at the 2007 silver price, the white metal posted a very solid performance to averages not seen since 1980. A key development in silver’s recent fortune has been the pronounced shift in investor behavior, witnessed by the continued presence of investors on the demand side of the equation since 2004.
During the first half of 2008, investors drove the silver price up above the $20/oz mark (a high of $20.92 oz was recorded in March) against a backdrop of generally firm fabrication demand. The second half of 2008 was a different story as the economic outlook deteriorated rapidly, and silver, as well as other metal prices, slumped. However, silver’s price in the first third of 2009 recovered a good part of the lost ground.
In 2008, a record inflow of over 93.1 million ounces (Moz) into the three main silver ETFs was instrumental in the high price average, as investors propelled silver to its highest price in decades, in not only daily price terms but also in the annual average.
Coins and medals fabrication jumped by an astonishing 63% to a record of 64.9 Moz in 2008. The main reason for this was a surge in investment-related purchases of bullion coins, both in the United States and Europe. Notably, fabrication of the U.S. Silver Eagle bullion coin achieved a record 19.6 Moz last year, approximately double the 2007 figure, and would have been higher if the U.S. Mint had sufficient blanks to produce coins to meet demand. In 2009, physical silver investment demand has continued to increase, as the U.S. Mint has already achieved a nearly 70% year-on-year rise in the first quarter.
Silver posted an average price of $14.67 in 2009, the second highest average since the high reached in 1980. Strong gains in investment and a recovery in demand later in the year, were the prime reasons for the 53% intra-year rise.
Much of 2009’s strength in investment can be attributed to soaring demand for silver exchange traded funds (ETFs) as well as physical retail investment. This occurred on the heels of 2008’s previous record ETF inflow of 265.3 million ounces (Moz) of silver. Total ETF holdings rose by 132.5 Moz over the course of 2009, ending the year at an impressive 397.8 Moz as new funds entered the marketplace from Australia and the United States.
In 2009, coins and medals fabrication rose by an impressive 21% to post a new record of 78.7 Moz, driven by a jump in retail demand, principally in the United States, although western European demand was also stronger in 2009. In the United States, the increase in its bullion coin sales was also accompanied by a surge in bar demand. Of note, demand for the U.S. Silver Eagle bullion coin reached record highs in 2009, with over 28 million Eagles sold. To put last year’s performance into context, over the 1986-2008 period, U.S. Eagle minting averaged 7.7 Moz per year.
Silver posted an average price of $20.19 in 2010, a level only surpassed in 1980, and a marked increase over the $14.67 average price in 2009.
World investment rose by an impressive 40% in 2010 to 279.3 million troy ounces (Moz), resulting in a net flow into silver of $5.6 billion, almost doubling 2009’s figure.
Exchange traded funds (ETFs) registered another sterling performance in 2010, with global ETF holdings reaching an impressive 582.6 Moz, representing an increase of 114.9 Moz over the total in 2009. The iShares Silver Trust accounted for almost 40% of the increase, with other notable gains achieved by Zurcher Kantonalbank, ETF Securities, and the Sprott Physical Silver Trust.
A significant boost in retail silver investment demand paved the way for higher investment in both physical bullion bars and in coins and medals in 2010. Physical bullion bars accounted for 55.6 Moz of the world investment in 2010. Coins and medals fabrication rose by 28% to post a new record of 101.3 Moz. In the United States, over 34.6 million U.S. Silver Eagle coins were minted, smashing the previous record set in 2009 at almost 29 million. Other key silver bullion coins reaching milestones include the Australian Kookaburra, the Austrian Philharmoniker, and the Canadian Maple Leaf–all three posting record highs in 2010.