
(yearly average prices based on London PM Fix)
By 1966 the Treasury’s program of eliminating silver from coinage was in place. The Treasury continued to use some silver in coins from then until 1969, but the annual average during these four years was 38.5 million ounces, down from 178 million ounces per year on average during the previous four years. Austria, France, and West Germany continued to use silver in some circulating coins until the late 1970s.
The U.S. government also continued to sell silver bullion. From 1966 through November 1970, 674 million ounces of bullion were sold. The higher silver prices had some effect on limiting its use, although the major factor was slowing overall economic growth and a shift in the economy away from the manufacture of goods that used silver. Industrial use peaked in 1966 at 414.9 million ounces. It declined 10% over the next two years, before stabilizing between 372 and 387 million ounces on an annual basis in the late 1960s and early 1970s.
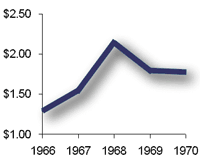
Investors remained keenly interested in silver, absorbing around 620.5 million ounces of silver from 1964 through 1970. Interestingly, the price of silver rose from $1.29 to a peak of $2.57 in 1968, before falling back. The rise and fall in silver prices was coincidental with the volume of these investor purchases: As investor demand decreased over the next three years, prices softened commensurately.